

AOD Heat & Mass Balance 101
A heat and mass balance is one of the most powerful tools an argon oxygen decarburization (AOD) operation can use to improve consistency, reduce the cost per ton, and eliminate rework. By modeling where the heat comes from, where it goes, and how materials flow throughout the process, melt shops can predict tap chemistry, stabilize reaction time, and boost yield. For producers of stainless, low-alloy, and specialty steels, a well-built balance model quickly becomes a competitive advantage.
Why Heat & Mass Balances Matter
The AOD process was developed to refine high-quality steels with extremely tight chemical tolerances. When heat and mass inputs are understood and controlled, operators can reliably achieve:
- High metallic yields.
- Carbon control to 0.01% and lower.
- Rapid desulfurization to <0.001%.
- Lead removal to <0.001%.
- Cleaner metal with low residual oxygen, nitrogen, and hydrogen.
- Flexibility to use lower-cost raw materials without compromising quality.
These results are only achievable when both mass flow (materials in vs. out) and heat flow (energy in vs. losses) are modeled and managed.
Mapping Inputs and Outputs
A helpful model begins with a clear summary of what enters the vessel, what leaves it, and what is lost during the blow.
Mass Inputs
AOD heats draw from three essential input categories:
- Hot metal makes up the most significant portion of charge weight and sets the baseline for decarburization targets (the processes of removing carbon from steel)
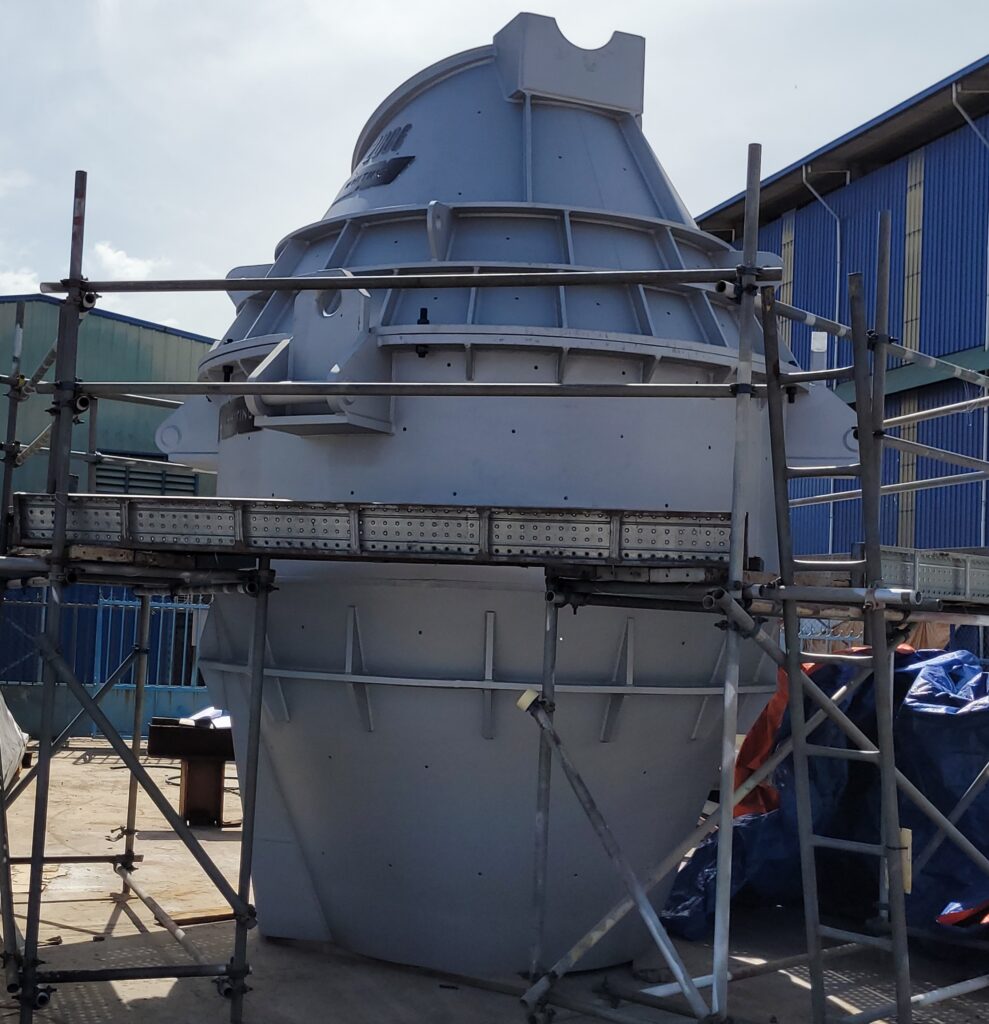
- Automated alloy and flux additions contribute smaller, but critical, mass adjustments for chemistry control. In one Whiting application, this was accomplished through a 22-bin automated system that weighed and inserted materials into the converter with high precision.
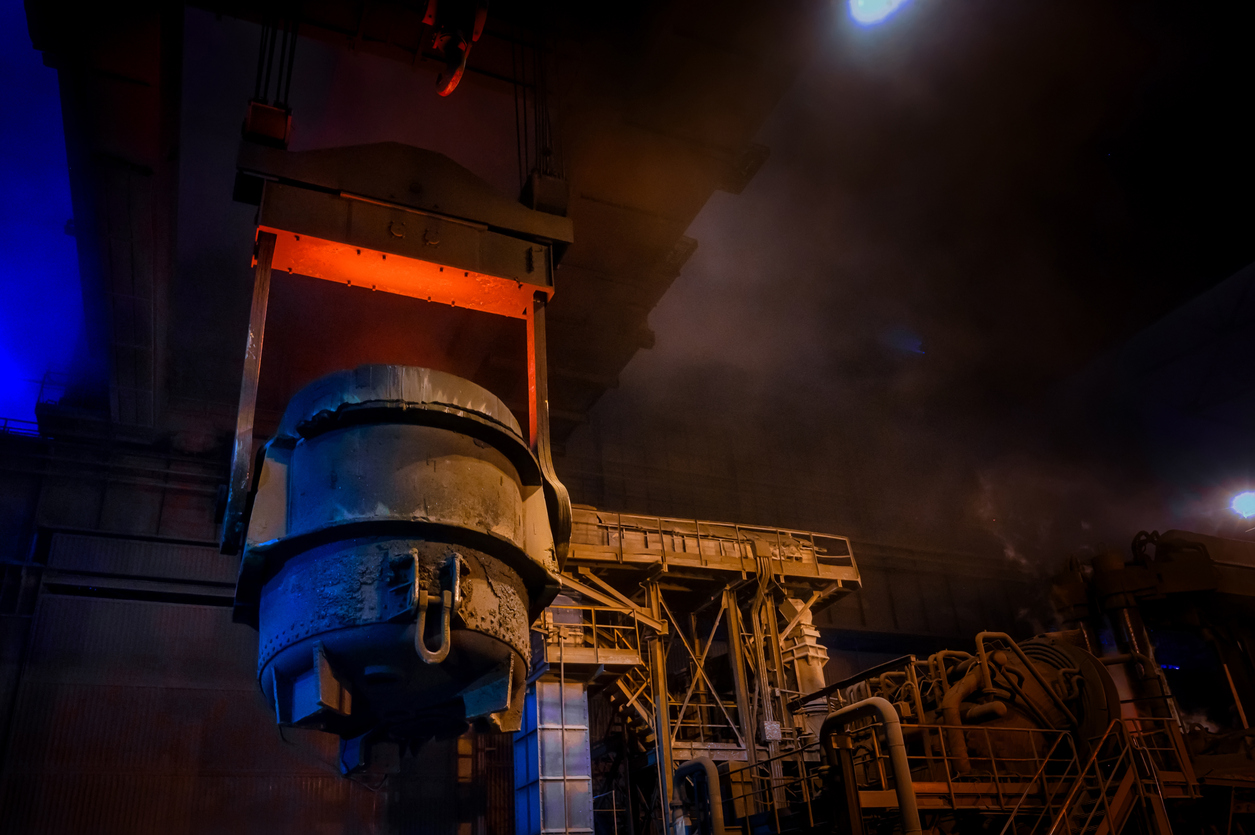
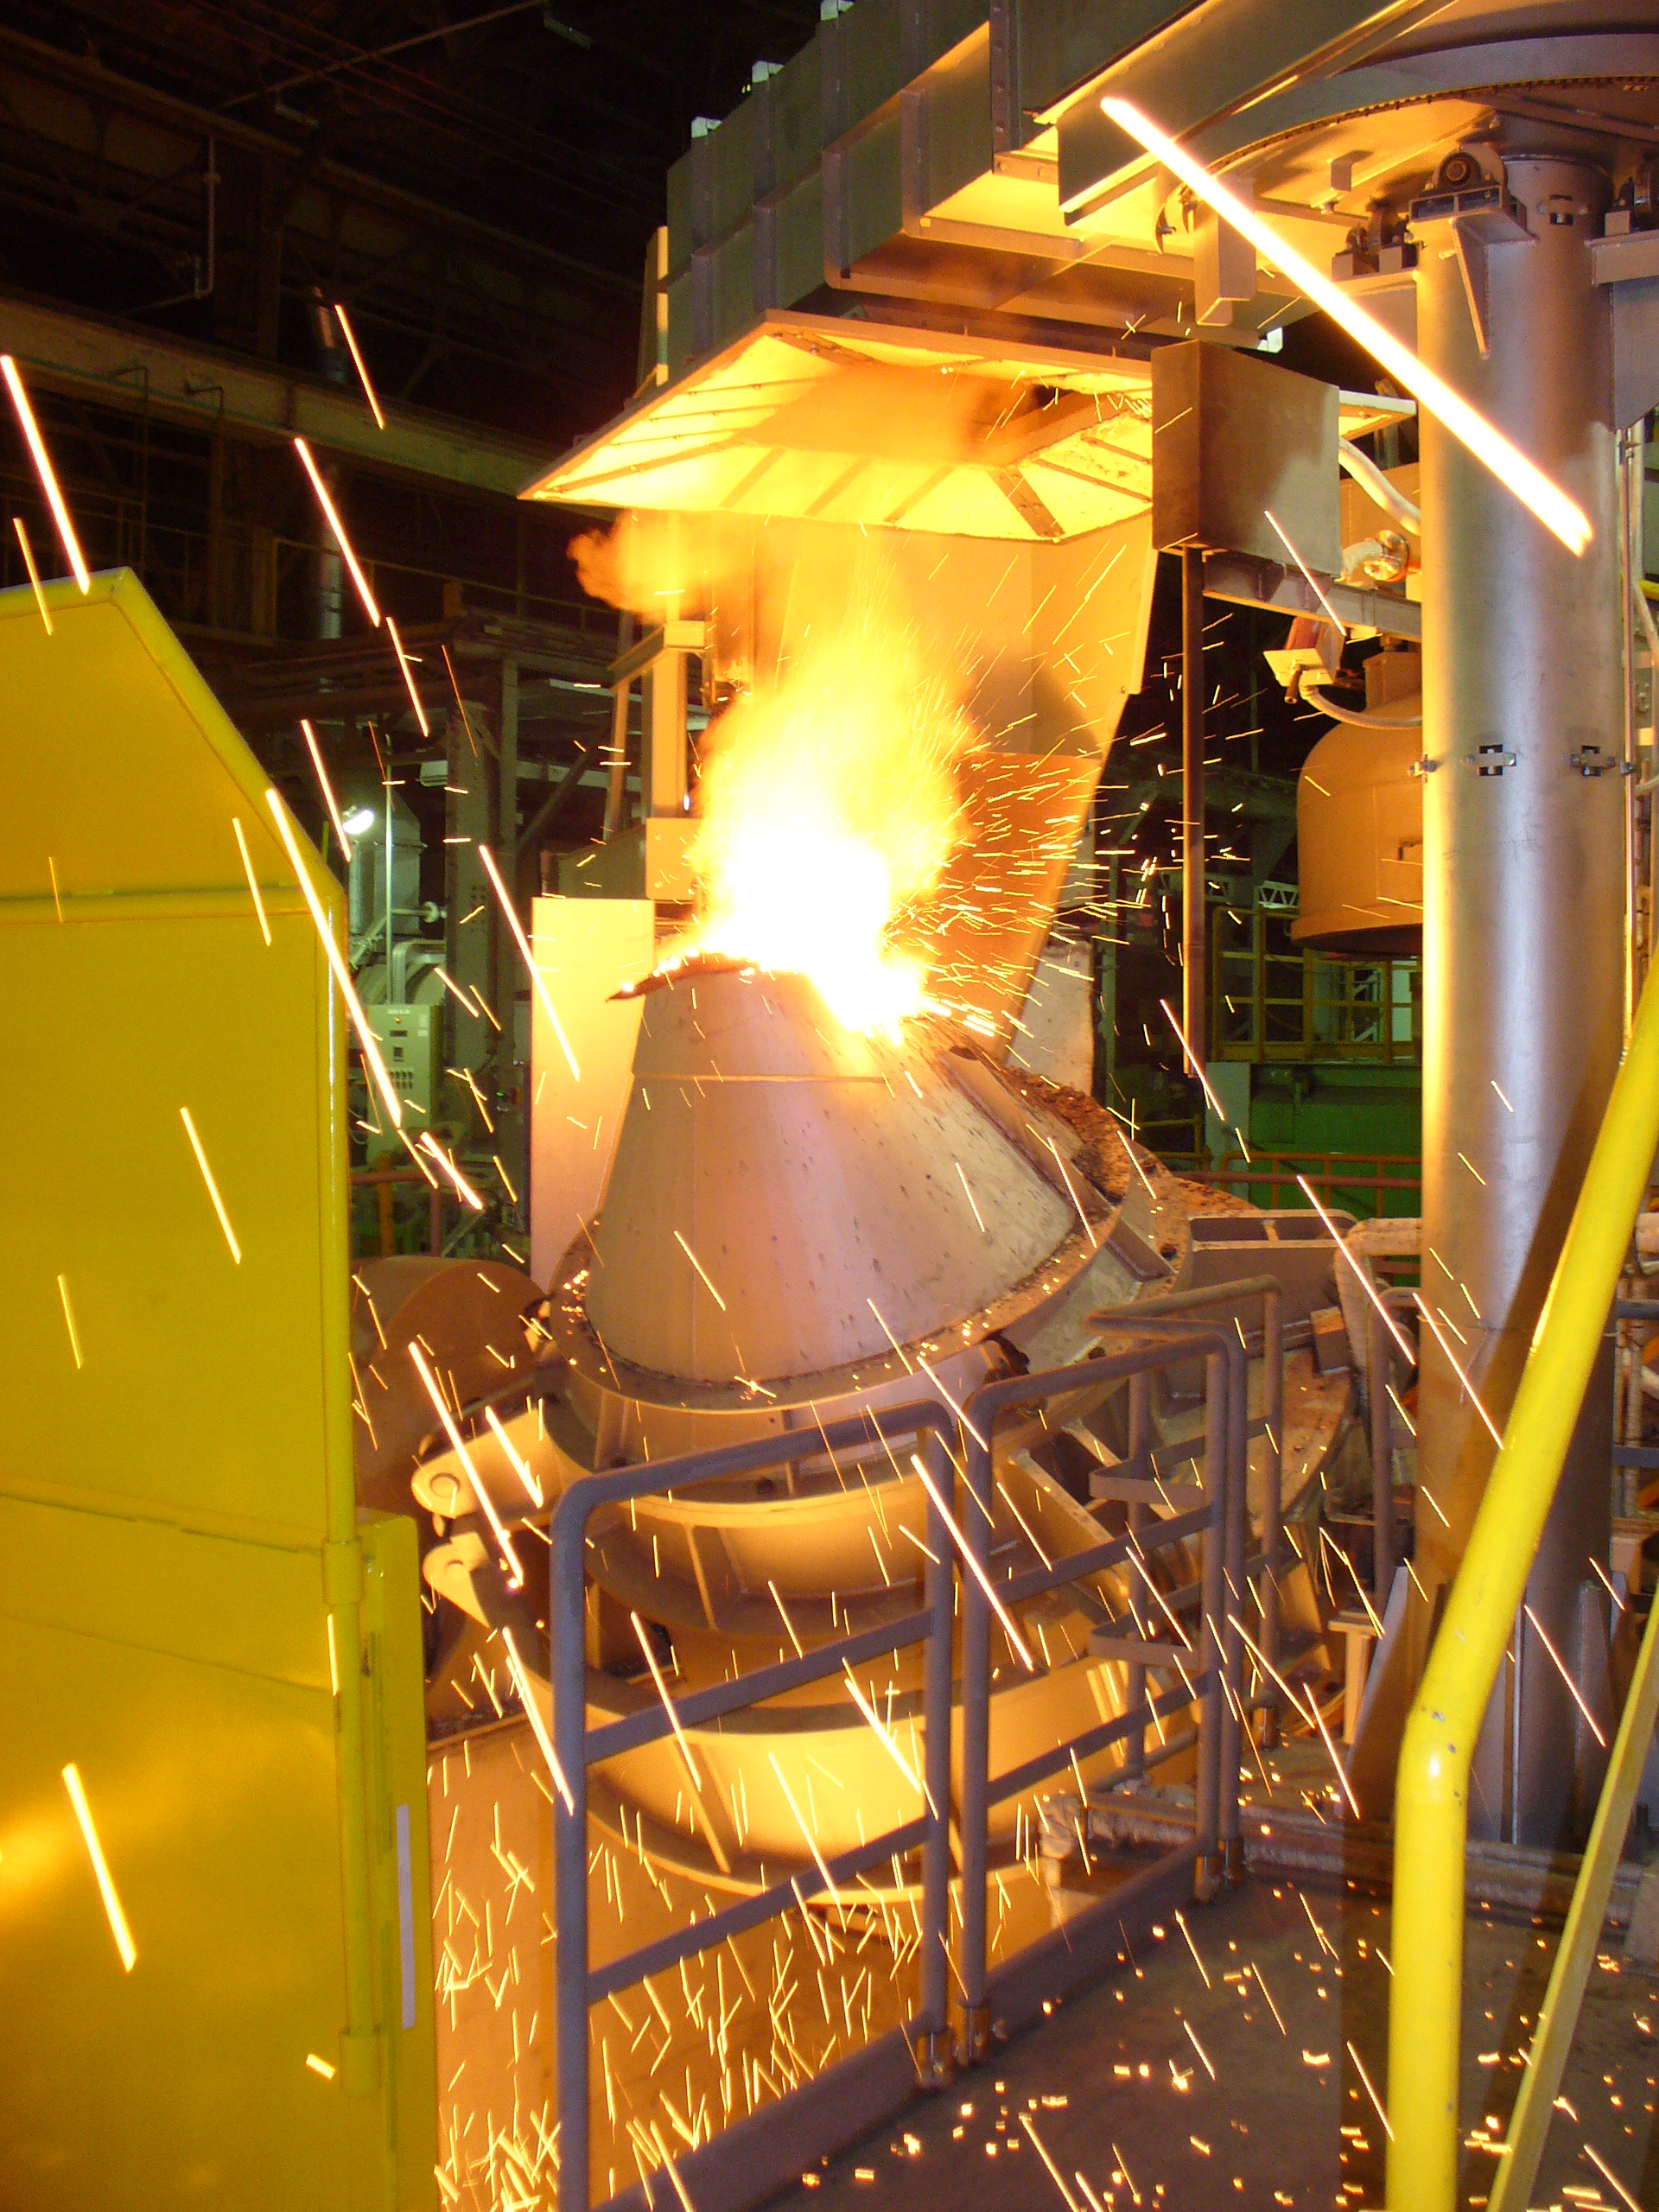
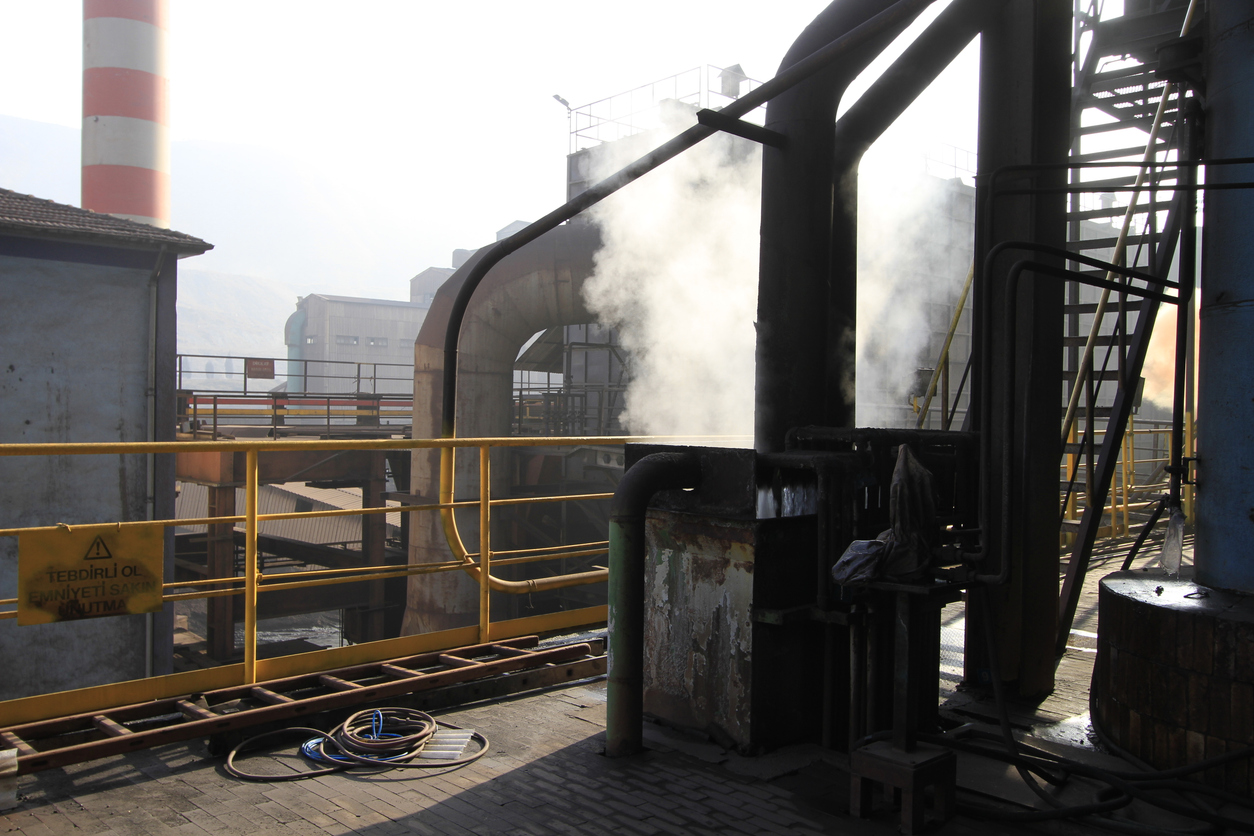
- Process gases enter through five bottom tuyeres and a water-cooled top lance, and because oxygen reacts exothermically, gas flow is a major heat source in the balance.
Mass Outputs (and Losses)
- Finished metal.
- Slag (removed via a 50-ton slag pot transfer car).
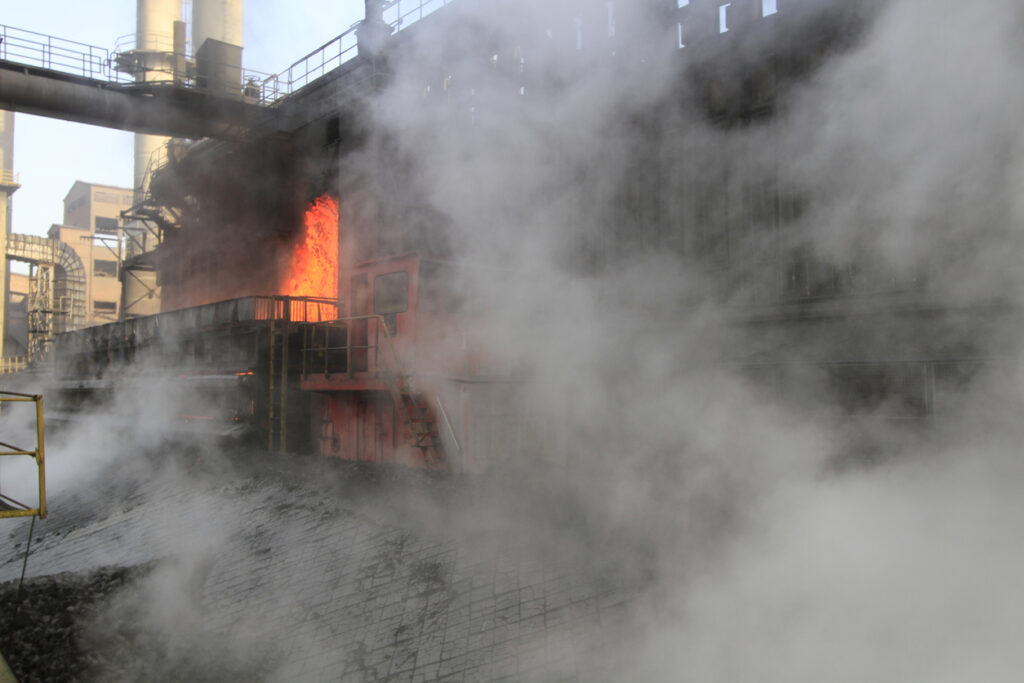
- Off-gas and fume losses (captured by a motorized, refractory-lined hood).
- Heat losses through water-cooled components and the vessel lining.
Understanding these outputs helps calculate yield and quantify energy efficiency.
Where the Heat Goes —Typical Losses
Even an efficient AOD process experiences heat losses that affect reaction kinetics and tap temperature. These three loss pathways dominate:
- Heat is removed through water-cooled equipment such as the lance and fume hood.
- Standby heat losses through vessel linings while idle.
- Conduction losses through the refractory, which increase as the lining thins.
Reducing unnecessary cooling and maintaining lining temperature stability are among the easiest ways to tighten the balance.
Optimization Levers That Improve Performance
Thermal efficiency can often be improved without major capital spending. Many melt shops use controlled preheating to stabilize lining temperature and reduce heat loss at the start of the blow. Many AOD systems commonly include:
- Vertical Ladle Preheater: 7 × 10⁶ Btu/h
- Vertical AOD Standby Vessel Preheater: 10 × 10⁶ Btu/h
- Horizontal AOD Operating Vessel Preheater: 10 × 10⁶ Btu/h
By keeping both operating and standby linings close to temperature, shops reduce thermal cycling, spalling risk, and burner use—supporting both refractory life and the heat balance.
Building a Practical Spreadsheet Model
A model does not need to be complex to be effective. Most shops begin with a worksheet that tracks:
Mass Data:
• Charge weight per heat.
• Scrap and flux additions.
• Alloy additions by type.
• Slag mass.
Heat Data:
• Chemical heat from decarburization.
• Burner/preheater energy input.
• Estimated standby and vessel heat losses.
Once baseline values are logged for several heats, the model can be tuned to reflect real performance rather than theoretical numbers.
Data That Supports the Model
Modern control systems make it easier to collect the data needed for ongoing refinement. Systems compatible with Whiting-supplied equipment, such as the Volta Furnace Master, record key values like heat running time, ladle running time, furnace downtime, and refractory running time. Because lining condition affects heat loss, tracking refractory running hours helps shops factor in lining wear into the heat balance as the campaign progresses.
Adding a simple gas-cost sensitivity tab allows operators to test scenarios, such as adjusting oxygen, nitrogen, or argon usage, and evaluate cost impacts before making changes on the floor.
Final Thoughts
A well-structured heat and mass balance is more than a technical document—it’s a decision-making tool. It enables tighter chemistry, reduces waste, supports refractory life, and helps operators see the actual cost of each lever they adjust. Over time, the model becomes a blueprint for more predictable, more profitable heats. Ready to learn more? To start a no-obligation conversation with the Whiting team, contact us.